For starters I want to say that Solomon Northup’s life sunk my heart. He was a free man for thirty years before he was tricked into slavery. I used storymap to map out his life with major events and the cites he was in. It was super cool to see the end product of the slideshow, as it shows the movement of his life travel. He was living his life as a farmer and violinist in Minerva New York. He then married his wife Ann Hampton and moved to Saratoga springs. To sustain his family he was looking for jobs with his violin skill. He was offered a job to play violin with a circus, once he had travelled with the circus to Washington DC. There he was tricked into slavery and his 12 years of being one began. Of course all slaved had a tragic story, but to have been free your whole life and then be taken captive is unimaginable. I chose photos that showed his whole lifetime. I started off with him as a kid to portray his childhood on the farm with his family, and the place was Minerva, New York City. Next I added a picture of his wife, Ann Hampton, and the place given was Saratoga springs. I wanted to include this because I feel it portrays the normalcy in his first 30 years of living which then shows the tragic contrast in his then enslaved life. I next found a picture that portrays people being tricked into slavery with the circus gimmick. Following that I added a photo of Solomon Northup in his enslaved years, which was a very sad photo, which would be a light representation of his enslaved life. Then my final photo was his book “12 years of slave”. I think it was important to show this wide spread set of events to really give a feel of what his life was like and the tiresome journey he had from a free man to getting his life turned upside down.
Monthly Archives: November 2021
geospatial visualization.
Geospatial visualization really strengthens the knowledge historians have of different time periods. I grew up being a visual learner. Weather that came to learning dance choreography, learning math or even makeup. The concept of Geospatial visualization surrounds using maps to tell the story of a period of time, the movement of people through pictures. People may ask why this is necessary whilst having straightforward informational texts and documents. While geospatial visualization may not be sufficient for learning just by it self. it adds a third dimension to learning. You can go back in time and see how people moved along the years and retrace these buried steps.
In theory there shouldn’t be anything too problematic with this method, but there definitely are. Since a lot of this concept is based off of grasping the photo there is a lot that can go wrong in interpretation. They are not always easy to understand. There can be a lot to look at and a lot to comprehend. They are not too information rich, which makes a lot of self comprehension. I struggle in the aspect of chronology, where does one look first? Looking at it as a whole does not do me too much help disecting it piece by piece and piecing it all together is the best bet.

This photo is a dot density map on the population of Baltimore. I can assure if I had seen numbers on a table I would not have understood as much as I am understanding visually right now. At just one glance I can see purple (white people), blue (enslaved black people), the comparison to these quantities are very easily understandable to the naked eye. When taking a closer look I can see how dense certain areas are and how sparse others are. If this was just a table with numbers, we would not be able to tell those differences in population so eloquently and quickly.
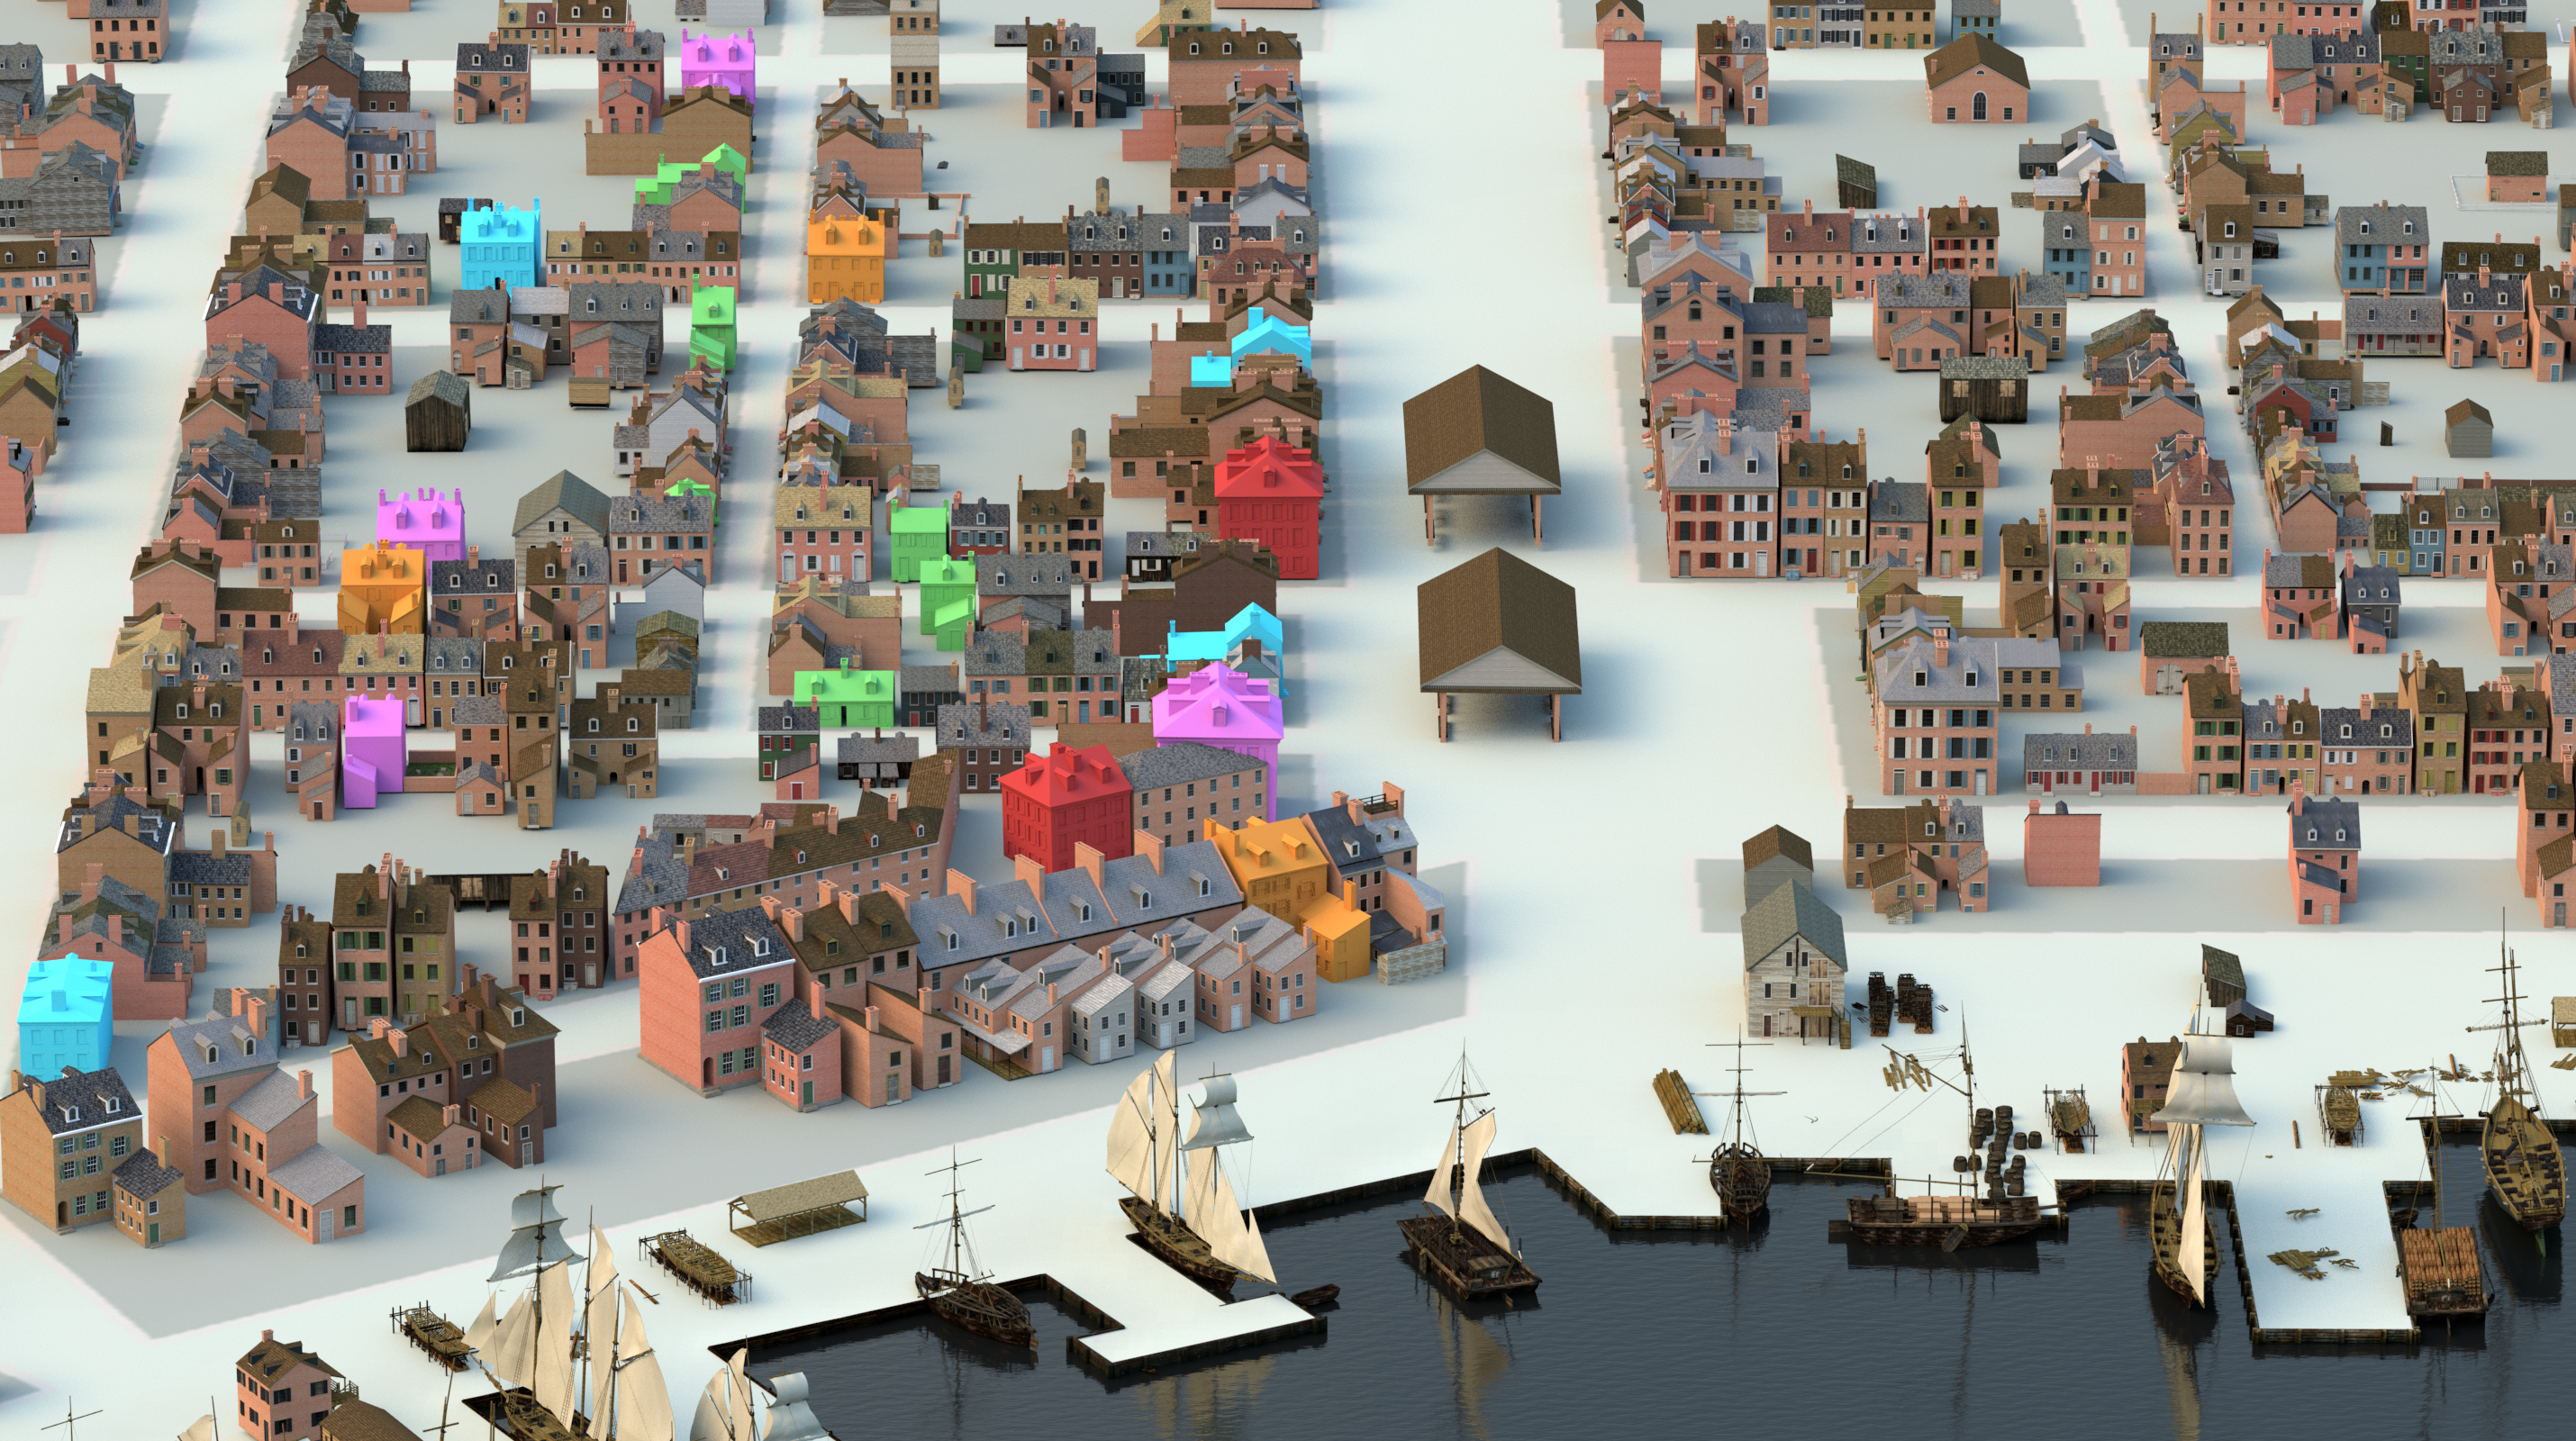
This image used different colored houses to represent difference races living in a neighborhoods. Although it would be a rookie mistake, getting mixed up between which owns which house would be problematic to understanding the real situation. That is not something that could be easily done with a table and the straightforward nature of a table.
portfolio 4
Computational text for me is an absolute essential. As a historian it is something that would lessen the work load a lot I feel. The manual era seems impractical to a person who grew up in the digital era, even things as simple as looking for book without a catalog, let alone research. One unsung plus of digitalization is the universal factor. Previous to these discoveries we would have to go to an area if wanting to read about it, now its a click away vs being an ocean away. This unites the world, we can only progress in time if we know to not make mistakes made before, and not only our own countries’ mistakes but other parts of the world included, with different point of views. Losing point of view can give historians a lack of full truth in research, the full picture will not yet be obtained. The time efficiency that comes with this tool is a huge game changer. Computers are obviously way faster when it comes to these things vs a manual research setting. You get to overlook thousands of of documents at one time while using this system. You have the option to access the more relevant source to you because of the sorting system by word relevancy. The text analysis makes it so you only see documents that have the most repetitive pattern of the topic of your choice. The documents with the most common words show up first, so you aren’t wasting time reading things that are of little relevance to you. I have spent hours reading through long articles just to know my topic search was only mentioned once in the whole paper, and the articles focus is no where near what I actually need. I can see how this will assist you in finding articles that overlap and agree with each other. Not only articles that agree but articles who carry the same load of the topic. The mining dispatch shows us the hands on benefits computational text analysis can have. Advertisements seeking enslaved peoples for labor was the source specialized here. Having a graph as a visual representation is the most helpful tool any researcher could ask for. The graph is what shows us what words show up the most in both topics . Imagine a human trying to recreate this skill, going thru with annotations of word count would be a redundant and un time savvy task. I cant imagine how many significant parts of history has been slept on because people did not have the same access to readings and mails and documents like we do now. Biased opinions, research that lacks the full picture, incorrect data. In all entirety computation text analytics was the best thing to happen to us historians. Weather that be talking about a time issue or comfort issue. When being the least stressed is when we can write at the most quality, the avoidance of frying your brain is what this gives you, setting you up for success.