Geospatial visualization really strengthens the knowledge historians have of different time periods. I grew up being a visual learner. Weather that came to learning dance choreography, learning math or even makeup. The concept of Geospatial visualization surrounds using maps to tell the story of a period of time, the movement of people through pictures. People may ask why this is necessary whilst having straightforward informational texts and documents. While geospatial visualization may not be sufficient for learning just by it self. it adds a third dimension to learning. You can go back in time and see how people moved along the years and retrace these buried steps.
In theory there shouldn’t be anything too problematic with this method, but there definitely are. Since a lot of this concept is based off of grasping the photo there is a lot that can go wrong in interpretation. They are not always easy to understand. There can be a lot to look at and a lot to comprehend. They are not too information rich, which makes a lot of self comprehension. I struggle in the aspect of chronology, where does one look first? Looking at it as a whole does not do me too much help disecting it piece by piece and piecing it all together is the best bet.

This photo is a dot density map on the population of Baltimore. I can assure if I had seen numbers on a table I would not have understood as much as I am understanding visually right now. At just one glance I can see purple (white people), blue (enslaved black people), the comparison to these quantities are very easily understandable to the naked eye. When taking a closer look I can see how dense certain areas are and how sparse others are. If this was just a table with numbers, we would not be able to tell those differences in population so eloquently and quickly.
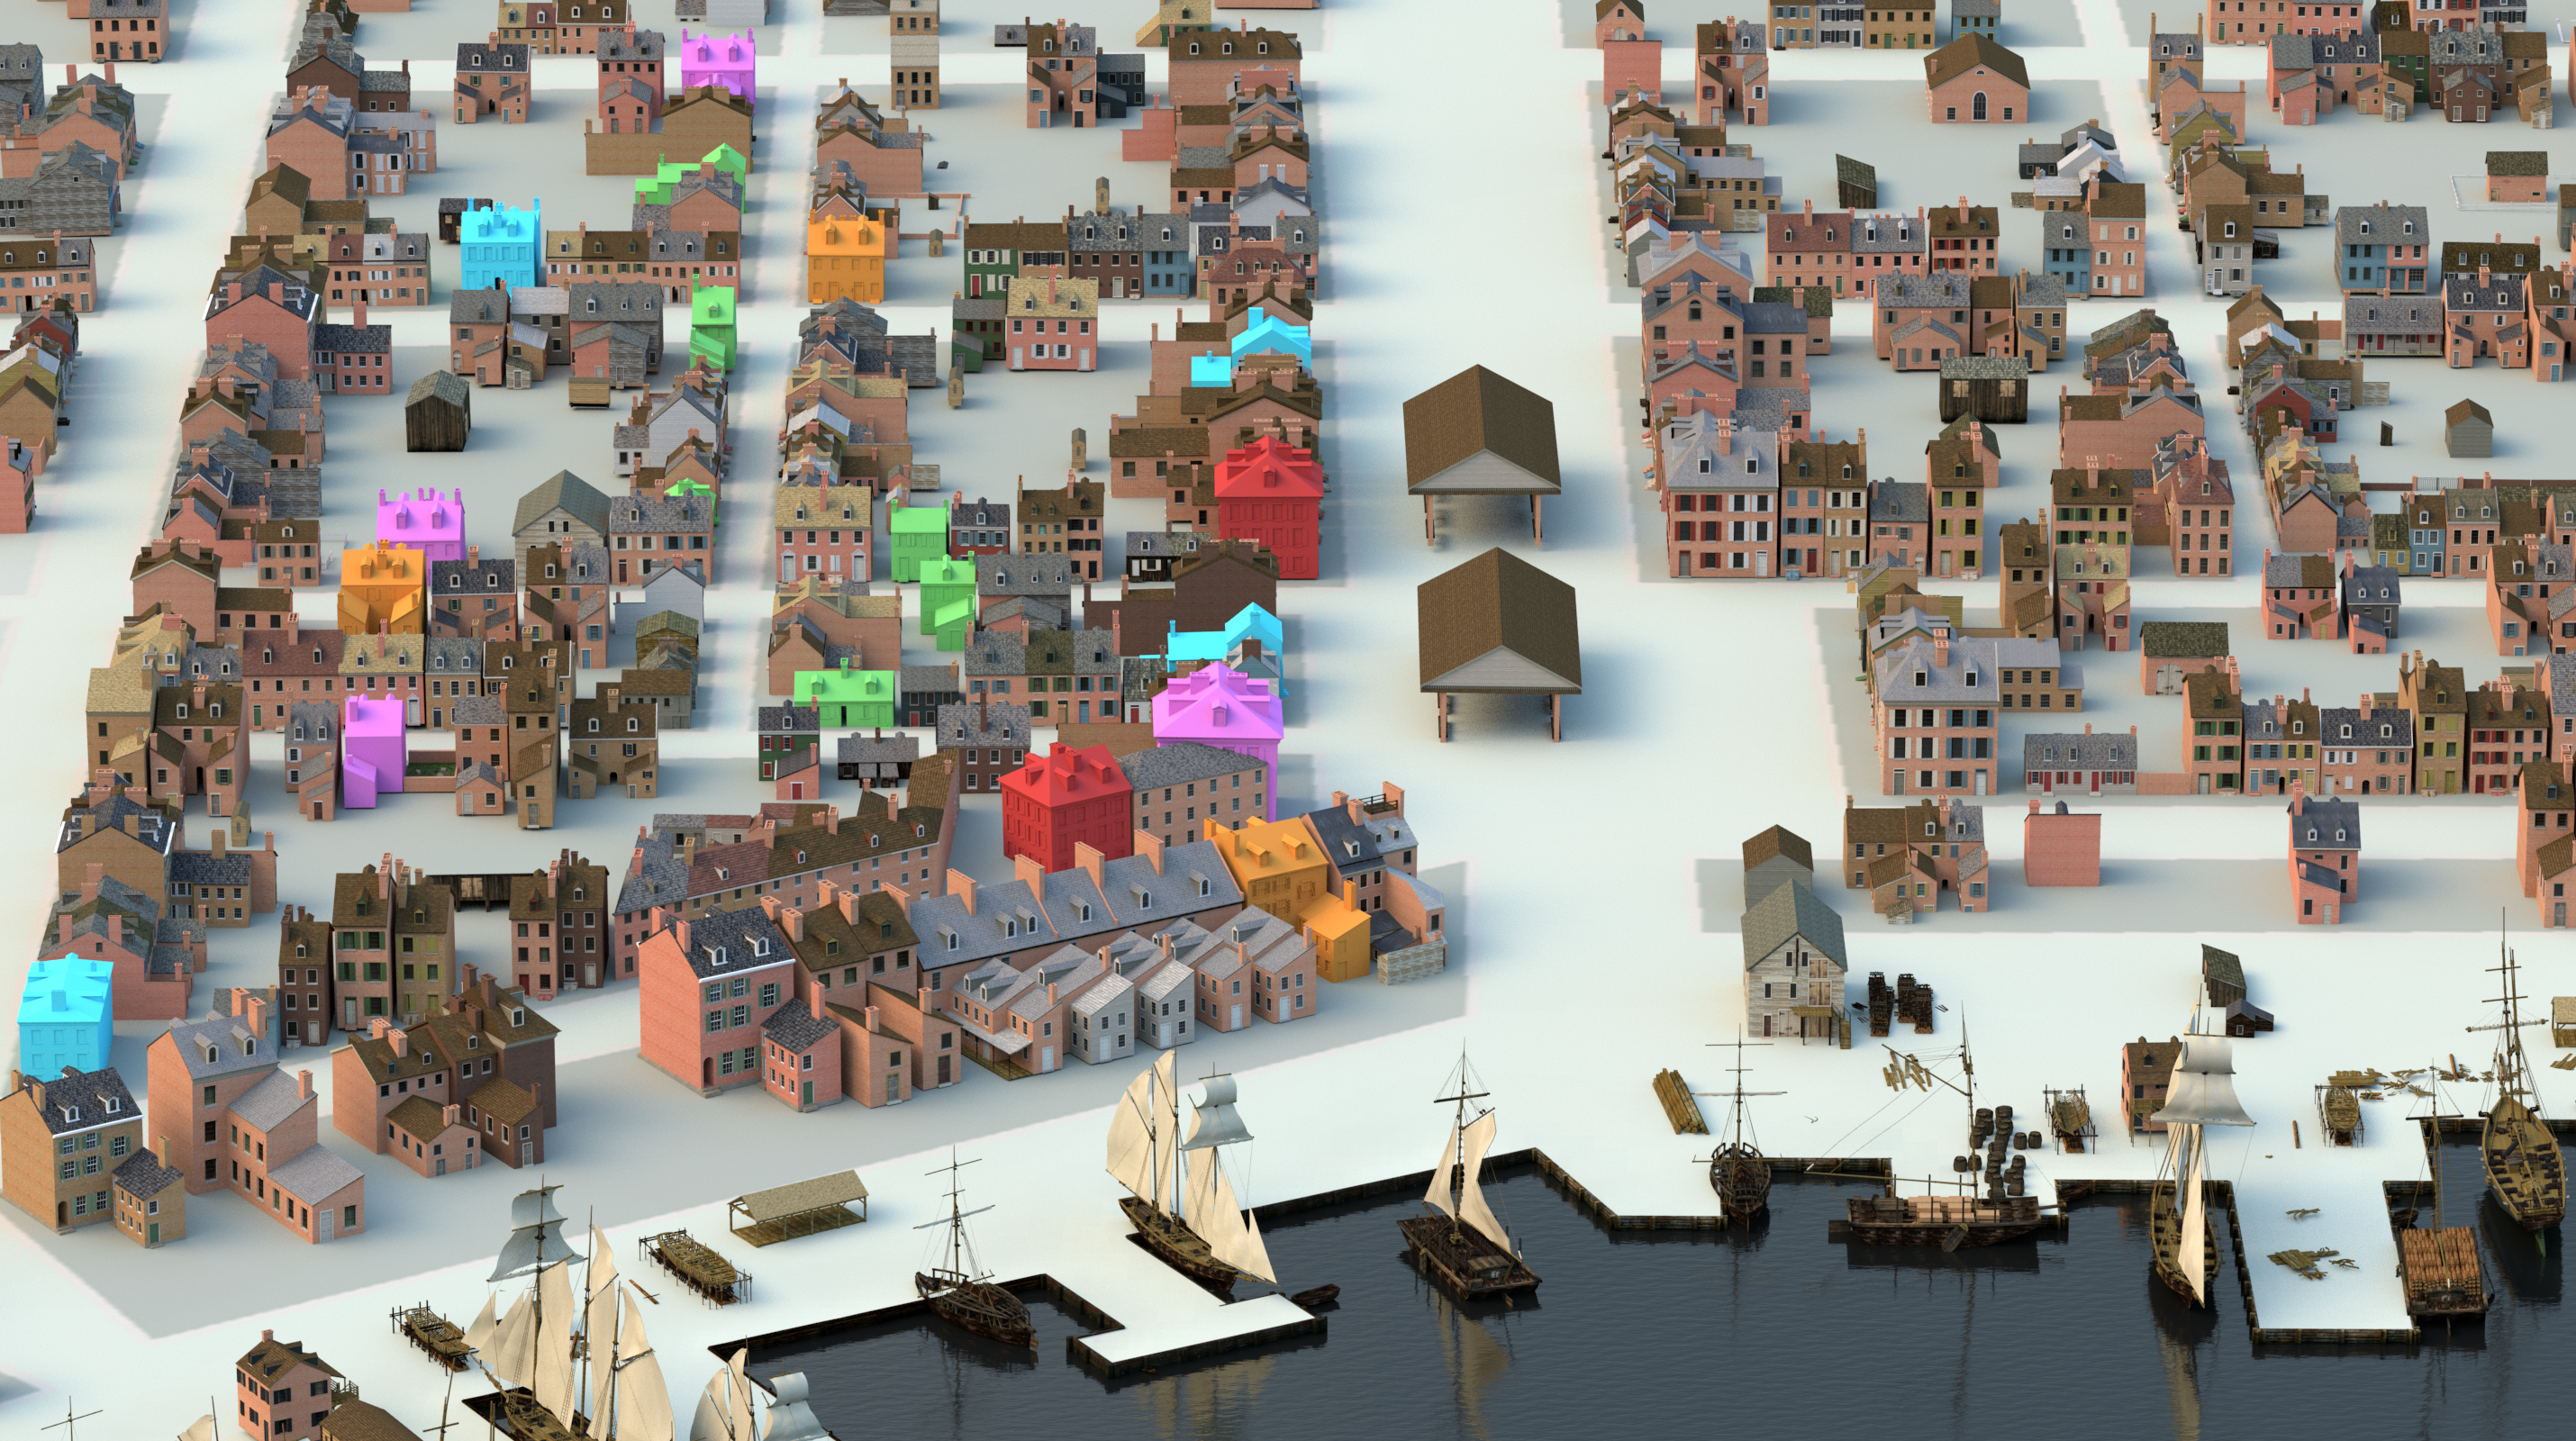
This image used different colored houses to represent difference races living in a neighborhoods. Although it would be a rookie mistake, getting mixed up between which owns which house would be problematic to understanding the real situation. That is not something that could be easily done with a table and the straightforward nature of a table.